The Washington Invasive Species Council evaluated more than 700 invasive species in and around Washington to analyze which posed the greatest threat to the state’s environment, economy, and human health. The council selected 50 priority species for action in the short term.
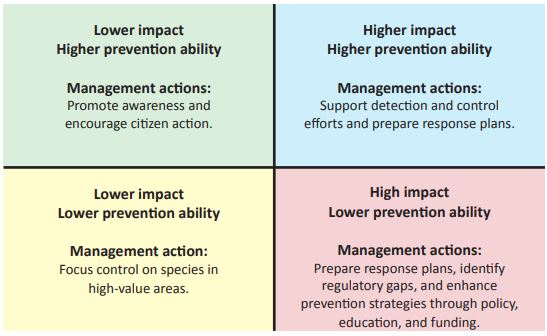
To do the analysis, the council developed an assessment tool that evaluated each of the 50 species on their impacts and ability to be prevented. The scores were plotted on the invasive species management priorities grid, which is being used as a tool to guide council action.
It is important to note that there are many other groups doing important work with invasive species lists of their own. Some include only plants or aquatic species, some are specific to a region. The council’s statewide list represents the top threats from all categories of species–plants, animals, insects, algae, and pathogens.
Invasive Species Management Priorities
Invasive species constitute one of the gravest threats to Washington’s plants, animals, and businesses dependent on the rich biological diversity here. Two critical parts to managing invasions are the following:
- Identifying the species that threaten resources
- Prioritizing species for management action
To better manage invasions, the council developed an assessment process to provide a transparent, repeatable, and credible basis for the it and partner agencies to prioritize management actions for invasive species (see assessment tool for more details).

Assessment scores are based on best professional judgment and science.
Here
1. Apple maggot
2. Brazilian elodea
3. Brown marmorated stink bug
4. Butterfly bush
5. Common crupina
6. European chafer
7. Feral swine
8. Flowering rush
9. Garlic mustard
10. Hydrilla
11. Infectious amphibian diseases
12. Invasive frogs and Invasive crayfish
13. Invasive knapweeds
14. Invasive knotweeds
15. Invasive milfoils
16. Invasive tunicates
17. Invasive zooplankton
18. Leafy spurge
19. Mediterranean white snail
20. New Zealand mud snail
21. Northern pike
22. Nutria
23. Parrotfeather
24. Phragmites
25. Poison hemlock
26. Puncturevine
27. Purple loosestrife
28. Rush skeletonweed
29. Scarlet lily beetle
30. Scotch broom
31. Scotch thistle
32. Spartina
33. Spotted wing drosophila
34. Tamarisk
35. White-nose syndrome
Near
36. Caulerpa
37. Spongy moths
38. Invasive crabs
39. Japanese beetle
Far
47. Kudzu
48. Onion leaf miner
49. Sirex woodwasp
50. Starry stonewort
The Scores
The assessment provides the following two scores for each species:

- An impact score that relates to a species’ environmental, economic, and human health threat
- A prevention score that relates to an agency’s ability to take preventative or early action for that species
For example, the higher the impact score, the greater the threat is to Washington’s environment, economy, human health, or a combination of them. The higher the prevention score, the greater the opportunity for an agency to prevent establishment of the species or the greater the agency’s ability to respond quickly to new infestations.
Both of these scores are plotted on a management grid to inform the council on future actions to take and to track the effectiveness of those actions. The actual scores are less important than the relative difference among species and the change in score over time.
The scores also will serve as a baseline against which to measure how effective the actions of the council and other agencies are in reducing a species’ impact and improving state agencies’ abilities to prevent new species from establishing, and to conduct a rapid response. The movement of a species on the graph will be important to enable the council to adapt it actions.
Creating the List
A work group of invasive species professionals, each with expertise in a different taxonomic group (e.g. terrestrial plants, insects, aquatic animals), identified species that pose the greatest threat to Washington’s environment, economy, and human health. While most of the species on the list already live in Washington, some are in the western United States as well as outside the western United States but in areas with similar climate conditions.
This is a dynamic list, which will be revisited and re-evaluated annually. At that time, new species posing serious risk to Washington will be added to the list and new information will be incorporated into species assessments.
How the List will be Used
The grid will guide council action, such as looking at the current ability to prevent new infestations, making policy recommendations, and identifying where more management or education is needed. It is intended also to do the following:
- Provide a uniform methodology for categorizing invasive species.
- Provide a clear explanation of the process used to evaluate and categorize species.
- Provide flexibility so the criteria may be adapted to the needs of different regions or organizations.
- Identify where more information may be needed.
- Educate about the impacts of invasive species and the ability to prevent them.
Meanwhile, the graph is not intended to do the following:
- Represent a scientifically-based risk assessment (this is an assessment based on best professional judgment).
- Produce a list that itself has regulatory force, though regulatory agencies may use the information to modify existing lists.
- Provide lists for any region because the invasiveness of species will differ from one region to another depending on geography, climate, ecosystems, and other factors.
How to Read the Grid
The grid is divided into four sections based on high and low impact scores and prevention scores. Management actions presented in the quadrants then pertain to the group of species falling there.
Download a printable version of this management tool.